An ISO 50001 energy management system
The logical platform
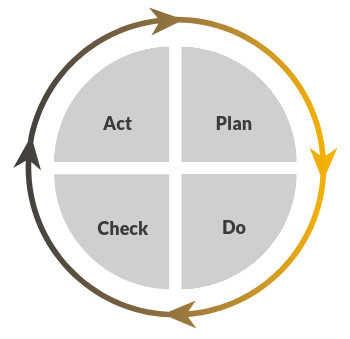
Deming cycle (iterative management method)
Goals of our platform:
- Making the energy iterative cycle as automatic as possible
3-Tier Platform

- Collects – Plan – energy production/consumption data from sensors, meters, on-board PLCs and intelligent machines (e.g. robot). From line operators also detects products made and discarded per unit of time to calculate the energy per unit of product

- Calculate – Check – the raw data and save it as time series, allows analysis, comparison, simulation, as well as integration with other enterprise applications. Via Artificial Intelligence connects real-time energy to all the other production factors that are interdependent/span>

- Performs – Do – the best logic derived from process analysis. Alerting functions: the system is aware of a current or foreseeable trend outside the range and warns the human in charge. Automation functions: flow-based industrial automation e.g. HVAC control (heating, ventilation, air conditioning, air quality)
The physical platform: hardware, software and engineering services

A hardware subsystem in two versions for IoT workshop
- WOLF Bridge multiprotocol – serial-TCP, Modbus RTU-Modbus TCP, DLMS/COSEM-TCP, ecc… it is used to make readable smart meters or other devices that support these protocols. Developed on devices ESP32 made by Bulgarian KMP Electronics and Moduino made by Polish Techbase
- WOLF Intell capable of interfacing machine on-board PLC, bi-directional photovoltaic meters, smart meters, sensors and weather stations. Can store locally on InfluxDB database

An Open Source software subsystem on a local, remote, Cloud server
- Web-server application developed in JAVA (SPRING, MAVEN, HIBERNATE, DB PostgreSQL).
- User interface (dashboard) in JAVASCRIPT (Angular)
- Collects, analyzes, presents field data; calculate KPIs; alerts the user via email.

Engineering services: sizing, design, construction management. Support to users
- Services provided directly or in partnership with UNI CEI 11339 certified EGE (Experts in energy management) in the area.
- Support to users provided remotely: phone, chat or email.
NOTE: all hardware products used are chosen from those available commercially and developed by European (Germany, Bulgaria, Poland) and Italian manufacturers, mostly Open Source.
All software is Open Source, released on https://github.com/myna-project/
Continuous analysis of consumption data: calculation, presentation, forecast

Functions of the ISO 50001 platform
- Multi-level hierarchical structure: allows to represent any productive environment in an analytical way
- Data collection: automatic machine-to-machine or manual using web interface
- General purpose measures: energy consumption, environmental data, production or resource consumption data
- Work with data: visualize and export the course in the time, aggregate and compare data, construct performaces indicators (KPI) observing if and as they change in the time
- Automatic alerting: send e-mail when measures missing or when measure is out of range

Insertion Measures
- Automatic loading from the field: via the Machine-to-Machine function that exposes REST HTTPS services or the MQTT protocol. Measurements sent using the JSON format
- Automatic loading from Energy Providers: automatic insertion of measurements present on CSV files and received by FTP from Energy Providers
- Manual loading: via web interface. It’s also possible to save the unit amounts of the individual items that make up the cost of energy to get the fourth-hour cost curve

Visualization, graphic form, performance indicators (EnPI)
- Aggregated: Average, Sum, Minimum, Maximum per unit time: minute, fourth hour, hour, day, month, year
- Operation: on the measurements of two quantities it is possible to apply sum, difference, multiplication, division
- Outcome: in line, column and heat chart format
- KPI: each user can define their own