Web application for the collection, continuous analysis and representation of energy consumption data, including RECs
Web application for the analysis of energy consumption data, including industrial RECs
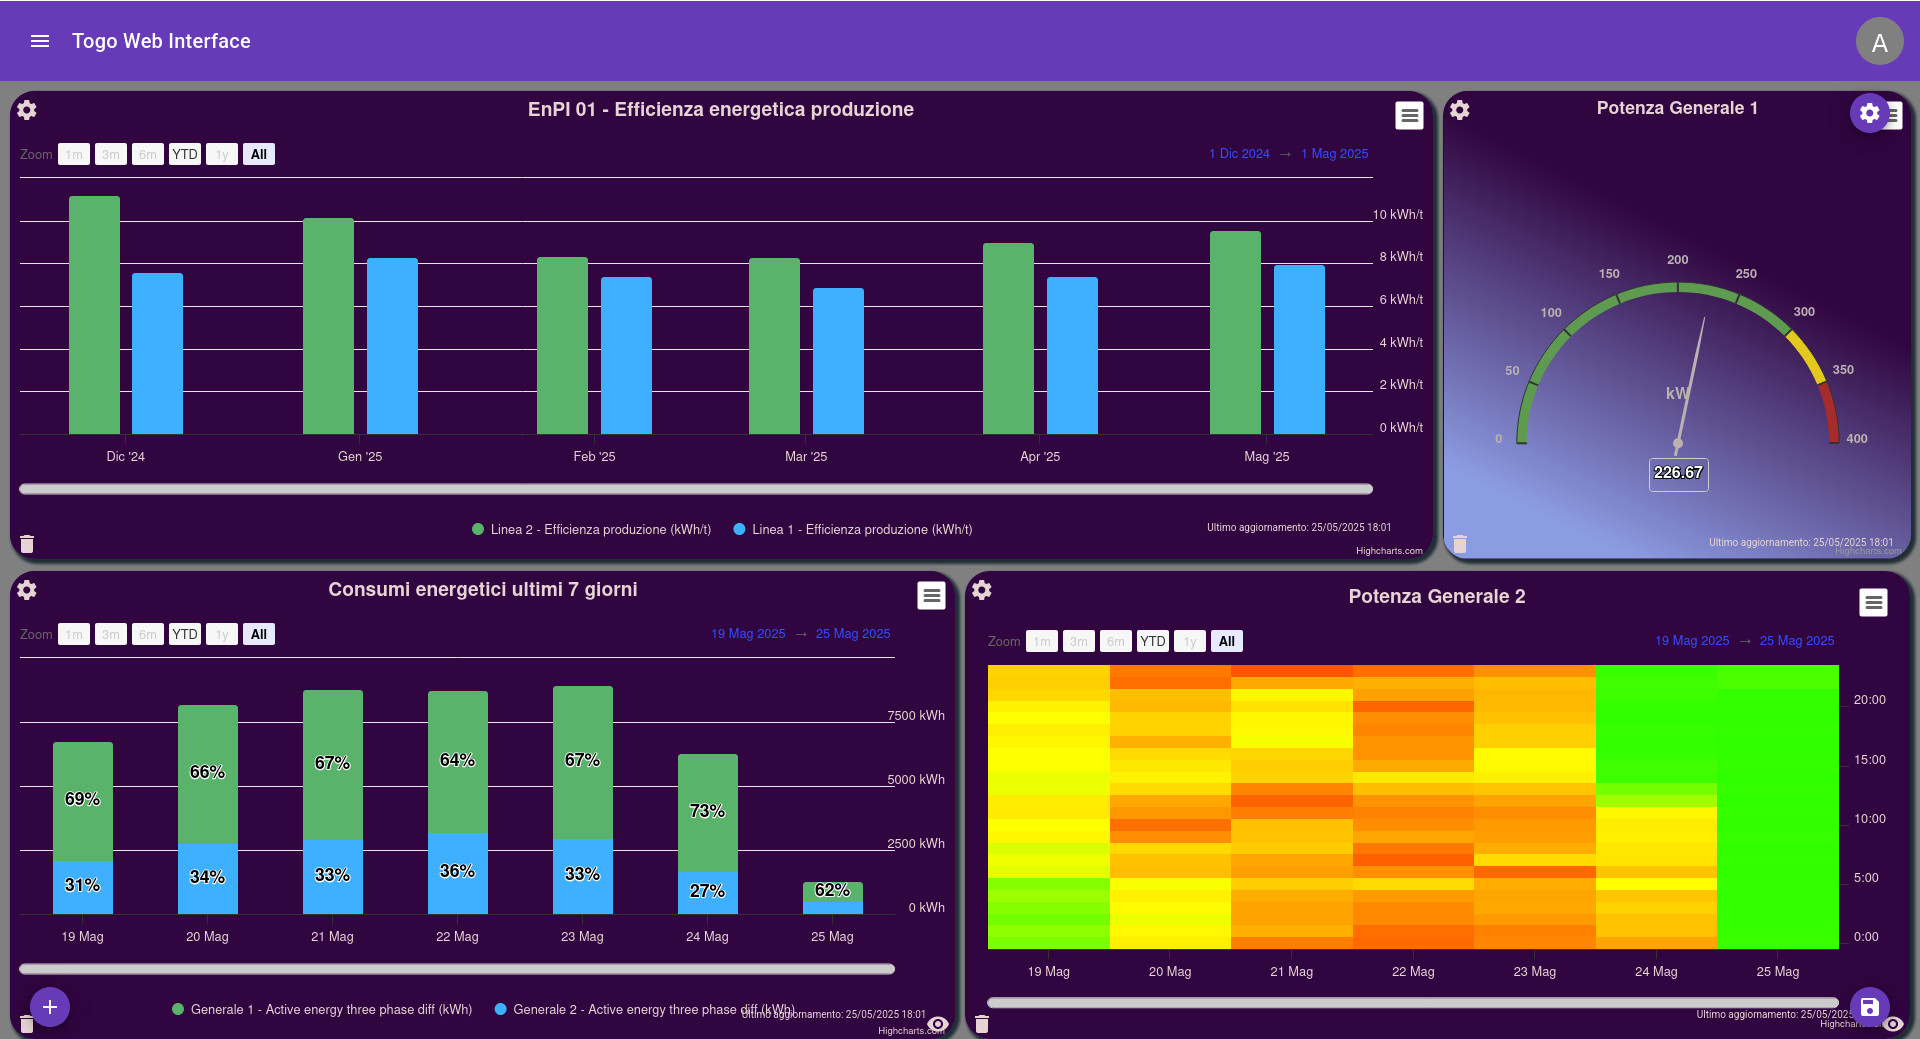
Example of dashboard on energy performance on PC, tablet or smartphone
Visit our demo! (username: demo – password: demo)
Product description
- Hardware Architecture
Any standard Linux server: microserver, physical or virtual server - Software Architecture
Web application developed in JAVA using SPRING, MAVEN, HIBERNATE, DB PostgreSQL
Web user interface in Javascript with ANGULAR framework - Reliability
3-level architecture: data is saved on the field (IoT) for 24 hours and then transferred to servers (back-end) backed up daily - Accuracy
Accuracy +/- 0.5% for commercial meters, or total with MID certified meters
Absolute accuracy on calculation and data presentation functions - Field measurements
They can be collected in machine-to-machine mode, using the HTTPS REST services exposed by the application, or the MQTT protocol. Measurements sent in JSON format
Alternatively, the measurements can be uploaded manually via web, or transferred from a CSV file, or received via FTP from the Energy Provider - Presentation
The collected measurements can be interrogated in an aggregate manner – Average, Sum, Minimum or Maximum Value – per unit of time – minute, quarter of hour, hour, day, month, year – or by applying mathematical formulas - Graphical
Display the query result in line chart, histogram, heat map or speedometer format - Dashboard
Each user can build their own custom dashboard in which the trend data is continuously updated as well as the supply of indicators and alerts - Indicators
Each user can create their own KPI (Key Performance Indicator) or their own EnPI (Energy Performance Indicator) that are recalculated continuously, real-time - Alerting
Each user can define checks at a predetermined rate that generate alerts sent by email when certain conditions occur: lack of measurements, number of measurements lower than expected, value measured out of range
Functional specifications also for Renewable Energy Communities (RECs)
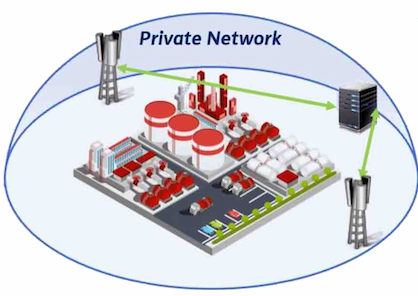
Example of “private bubble” 5G serving an exclusive Industrial Renewable Energy Community
Economic accounting for REC: input and display via web interface
- Automatic calculation of the costs of energy consumed and shared
- Automatic calculation of each member’s energy balance
- Generation and persistence of cash flows obtained from the costs of energy consumed and shared
Membership of the REC: definition and persistence of individual member information (association with individual POD)
- Possibility for each member to attach individual documentation
“Representative CER” dashboard web-based and/or mobile: Displays personal data and geolocation of the POD
- Add, remove and edit member data
- Defining the energy performance indicators
- Select the type of data visualization chart (histogram, line, speedometer, heat map)
- Continuous monitoring of overall consumption, production and energy shared between REC members
- Data and graphics export in image or . pdf format
“Member REC” web-based dashboard: All the features provided for the Representative, but only related to your POD
Data ownership and privacy
- The user can download at any time their data in CSV format via web interface and request the deletion and transfer of their data
- The interface is accessible only to registered users and each of them can view only the data of the POD to which it is associated
Allocation of benefits among REC members: The platform allows you to implement any allocation and payment of economic benefits
Interoperability
- Ability to receive/transmit data to other platforms, such as Distributors and energy suppliers, including interface with the GSE, using the REST services exposed by the latter
- Interface with existing standard meters
Meter reading frequency: Between a minimum of 1 minute and 3 minutes
PLUS
- Private bubble 5G of continuous interconnection between the partners of the industrial area